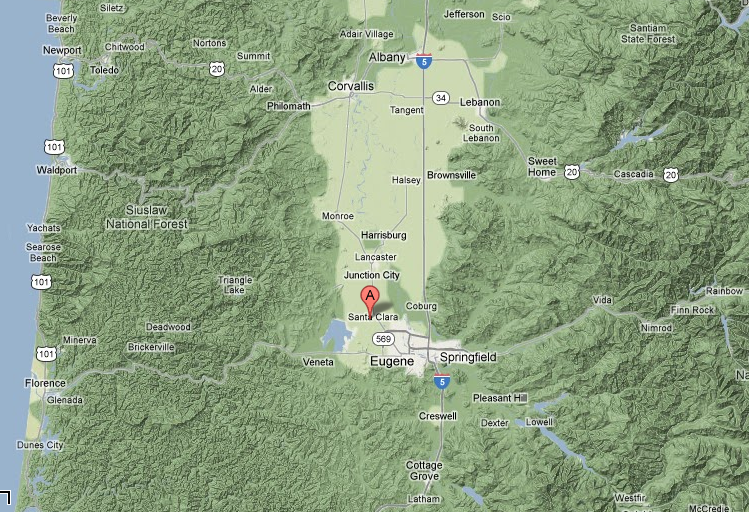
Wednesday, May 9, 2012

Final Blog

Final Blog Post
Eugene, Oregon
The Future of Weather and Climate in Eugene


According to the Intergovernmental Panel on Climate Change, the future of weather and climate in many regions of the world is fairly grim and dire. Eugene is no exception. The West Coast of the United States is one of the few areas in the nation the IPCC predicts will not warm as drastically as the rest of the nation. The IPCC predicts Eugene will warm about 3-3.5 degrees Celsius (5.4-6.3 degrees Fahrenheit) by the late 21st century. The IPCC also suggests precipitation will shift dramatically as well, with more precipitation being present in the winter months, and less in the summer months. Depending on the extent of change present within the precipitation patterns, precipitation may end up balancing out on an annual basis, and only changing seasonally. The IPCC predicts an increase in tropical cyclone intensity, and a poleward shift of extra-tropical storm tracks, which may impact Eugene with stronger storms reaching farther north. Eugene is typically not susceptible to tropical storms or hurricanes, but may see storms with stronger sustained winds, increased precipitation, and a shift in temperature patterns, further aggravating storms because of air mass collisions becoming more violent. The IPCC predicts precipitation events will be more extreme, but less frequent. Flooding may be a true concern in Eugene because it is the lowest point in a valley, at the convergence of two rivers. A widespread significant rain event could potentially flood both rivers and bring large volumes of water to Eugene, ultimately leading to the Pacific Ocean. Ocean rising is not particularly a concern for Eugene, as it is far away enough from the coast, and protected by an elevation of 367ft above sea level.

Source: IPCC Climate Change 2007 Synthesis Report
As shown by this image, the Eugene area, and the West Coast of the United States is one of the areas that will experience less warming than the rest of the world. Impacts may still be detrimental.  The IPCC stated that Greenhouse Gas Emissions have increased 70% between 1970 and 2004, which very likely accounts for the observed increase in global average temperatures since the mid 20th century. (IPCC Summary PM, p. 5) Further support for the IPCC's claim that greenhouse gasses dramatically effect the climate is found during the past 50 years when, "the sum of solar and volcanic forcings would likely have produced cooling" (IPCC Summary PM, p. 5).
Source: IPCC Climate Change 2007 Synthesis Report
Predicted Precipitation Changes December through February.
This shows Eugene in an area expected for precipitation to increase by about 5-10%  for the period 2090-2099.  Eugene is between two areas in the map, one where less than 66% of the models agree on the trend, the other where over 90% of the models agree on the type and extent of change, likely an indication that most models to agree Eugene will face more winter precipitation, and less summer precipitation (below).
Source: IPCC Climate Change 2007 Synthesis Report
Predicted Precipitation Changes June through August.
This shows Eugene in an area expected for precipitation to decrease 10-20% during the summer months. This map also indicates over 90% of the models agree on the type and extent of the change. Although, in this case, Eugene is on the border with the coastal region, which estimates only a 5% loss in precipitation during the summer months, which makes interpreting the map, and exact locations while taking into account transition zones extremely ambiguous.
Data Compiled from the City of Eugene Comprehensive Annual Financial Report for Fiscal Year 2011.
Analyzing solely the ten principal employers in Eugene (accounting for 13.29% of total employment in Eugene) suggests Eugene may actually benefit from climate change. The IPCC suggests health impacts of climate change will be quite dramatic, from dehydration to more wide-spread infectious diseases. Growth of the healthcare industry will be essential to maintaining quality of life during climate change. Peace Health Medical Group may end up growing exponentially. As fewer places in the nation become comfortably or affordably habitable, some common places to live and go to school such as Phoenix, Texas, and other vastly populated areas may begin seeking schooling and habitation elsewhere. The University of Oregon may grow dramatically if this scenario unfolds. Consequently, as the population in Eugene continues to grow because it will be a relative comfortable place to live with climate change, more schooling, government services, and private services will become essential, which suggests the Eugene area may benefit (economically) dramatically from climate change. 

The city of Eugene has compiled a Community Climate and Energy Action Plan (Click to Access) highlighting many areas of concern given climate change, and the costs associated with climate change. The report focuses on Buildings and Energy, Food and Agriculture, Land Use and Transportation, Consumption and Waste, Health and Social Services, and Urban Natural Resources. Within each category, certain agenda items to mitigate or prevent any adverse effects of climate change or rising energy costs are addressed. The climate change mitigation highlights from the report are as follows:
  • For buildings and energy, the city recommends the use of passive systems for heating, cooling, ventilation, and water delivery and will encourage the use of potable water where appropriate.
  • For food and agriculture, the city is attempting to reduce use of carbon intensive foods (for growing, transportation, etc.) through education. Eugene is also attempting to increase the amount of diverse weather foods grown in the Willamette Valley in order to sustain extended droughts and wet periods. Eugene is also attempting to use grey water on crops, and is prioritizing vegetable protein crops such as beans and grains. 
  • For land use and transportation, the city is attempting to create '20 minute' neighborhoods so that residents can walk or bike to gather essential needs. Eugene noted that monitoring population and development is extremely important to mitigation of climate change risks.
  • For consumption and waste, the city would like to make picking up waste more efficient, increase the use of renewable materials, and reduce greenhouse gas emissions through municipal activity by purchasing quality goods. Eugene will follow recommendations from the EPA's West Coast Climate Forum to address the highest priority methods to reduce GHG production in waste management.
  • For health and social services the city will prepare for long term climate and energy challenges including increased summer drought and increased storm intensity. The city will also ensure all essential services are located within the 100 year flood zone, and mitigate destruction from wildfire risk.
  • For urban and natural resources, the city recognizes the importance of natural resources to mitigate the effects of climate change, such as vegetation to provide cooling and absorb CO2. The city plans to preserve and expand natural areas, while also attempting to bring natural resources into the city, such as incentives for residents to plant trees. The city also plans to enhance protections of drinking water sources, and plan for more wildfires.
    (Appendix Used May Be Accessed Here)
    All information obtained directly from the City of Eugene Community Climate and Energy Action Plan.
Source: HowStuffWorks.com
Climate change will pose a variety of unique challenges to the Eugene area, including preserving native species in the wake of a warmer habitat including increased natural risks, including fire, drought, and increased storm intensity.


Wednesday, May 2, 2012

Blog Post 3

Blog 3: Climate Controls 
Eugene, Oregon


Eugene, OR - An Urban Heat Island?

The population of Eugene. Compiled using data from wikipedia, which used data from the U.S. Census, and Moffatt, Riley.
The average annual mean temperature of Eugene. Compiled Using data from weather station KEUG. The temperature compared to the population suggest that Eugene is not an Urban Heat Island, although the data begins during the 1940's, which is likely not the best time to begin a study for urban heat islands as it was the end of the industrial revolution. The temperature shows a negative linear trend, while population shows a positive linear trend, suggesting this may be caused because air quality standards started coming into play, with the phase out of atmospheric heat causing ovens and pollutants.
Image Credit: USGS Topo Project (store.usgs.gov) (Click for full size)
Shown within this topographic map of Eugene, it is evident Eugene sits at the bottom of a valley, a naturally occurring micro-scale climate control. Eugene is also at the confluence of two rivers, which has proven to make Eugene prone to flooding in the past, and essentially allows the valley to breathe. The rivers, and Eugene's geographic position make Eugene prone to high winds coming down the river valley's to the lowest point (similar to Denver's winds coming down the mountain canyons to the front range). 
Image Credit: Google Maps
Weather Station KEUG is indicated by the red 'A' balloon. Because the weather station is near the south end of the valley, it may experience more wind than in the center of the valley, resulting in cooler temperatures. Fern Ridge Lake, which is to the Southwest of my weather station my affect temperatures at the station depending on the wind direction. The lake may also, on an extremely local level, affect fog, especially during the winter months, and nighttime temperatures due to a higher albedo, and being cooler than the surrounding air, especially during the summer months. The fact that the weather station is at an airport will affect local albedo's, smog, and may contribute to frontal development. Heat from the airport surface, airplanes, and large asphalt parking lots rising and mixing with colder air from the Pacific Ocean, or Aleutian Low, may cause a wave, then cyclonic circulation. The weather station is not typically affected by Interstate 5, or the Eugene-Springfield downtown area, because weather patterns typically move through the area East-Southeast. The weather station, however, may occasionally be affected by the Interstate and Downtown areas if Orographic lifting is required to move an air mass out of the valley, and the air mass presents a cyclonic pattern while stationary in the valley. North of Eugene is heavy agriculture use, which may present some pollution to Eugene, such as pesticides or other agricultural remnants.
Image Credit: http://www.nc-climate.ncsu.edu/edu/k12/.JetStreams
As shown in this image, the meso-scale air mass dominance can change dramatically in Eugene from summer to winter.  During the winter, the jet stream is lower, causing Eugene to be much cooler because of maritime polar and continental polar air coming south, especially off of the Aleutian low. During the summer, the jet stream rises, making Eugene more susceptible maritime tropical air masses, and occasionally continental tropical through mid-latitude cyclonic action.
Image Credit:  http://cses.washington.edu/cig/pnwc/pnwc.shtml
Eugene is nestled directly between the Coast Mountain Range and the Cascade Mountain Range, suggesting  Eugene's orographic situation is a key player in meso-scale climate controls. 
Image Credit: Wikipedia (Modified Image)
According to the Koppen-Geiger Climate Classification System, Eugene sits in a 'Csb' zone, or  Dry Summer Subtropical areas. This is contrary to what is commonly believed to be the trend in the Pacific Northwest. Eugene is much drier and warmer during the summer than any other season, so the classification makes sense, although Eugene is not well-known as a 'dry' area. It seems a more accurate climate classification for Eugene, and much of the west coast, would be a weather transition zone, for weather moving from maritime fronts to continental patterns.

Image Credit: http://www.world-climates.com/city-climate-eugene-oregon-usa-north-america/
The climograph presented here, supports the Koppen-Geiger Climate Classification for Eugene.

The temperature trends graph shows no true consistent trend for Eugene. The trend line for the July minimum temperatures is virtually flat, while the January minimum temperatures trend line is rising, although there is considerable variation among those temperatures. I expected to see an increase in temperatures as the University of Oregon became more established, although I cannot find that trend to exist. The temperature dip of 1955, evident in all except July Minimum temperatures, is also very puzzling. Overall, the temperature trends seem to be warmer winters, but stable summers, which may suggest a shift in frontal patterns, or Pacific Coast currents. 
Have A Nice Day!

Monday, April 16, 2012

Reflection 1

Blog Reflection 1
Comparison of Eugene, OR to Bangalore, India

Courtesy: Google Maps
Within this map Eugene, OR is indicated by the blue balloon and Bangalore, India is indicated by the red balloon. Eugene sits at approximately 44.1˚N and Bangalore sits at approximately 13˚N. Because of Bangalore's proximity to the equator, it is subject to the forces of the Intertropical Convergence Zone (ITCZ), especially during the summer months, when the ITCZ passes directly through Bangalore. Eugene is never subject to the ITCZ, and is instead affected by mid-latitude cyclones, coming off of oceanic currents and weather patterns from the north west. As shown in this map, Bangalore sticks out from the continent into the ocean, much like Florida, which may cause strong storms to pass over - weakening on land, then strengthening again. Water supply for storms over India are readily accessible, from the south, northwest, and northeast to an extent, providing fuel to many different types of storms. 

Courtesy: Weather.com
Evident from this graph, and largely expected due to both locations respective latitudes, Bangalore, India is much warmer than Eugene, by about 22 degrees on average. 

Courtesy: Weather.com
Although statistically, Eugene is wetter then Bangalore, India by 10.5 inches, this graph clearly indicates the time of year dictates which location will be wetter in a given month. For instance, in September Bangalore averages 9.6 inches of rain, while Eugene only averages 1.3 inches. November through April shows that Eugene is much wetter most of the year though. 

AIR MASSES
Courtesy:  http://www.globalsecurity.org/military/library/policy/navy/nrtc/14312_ch4.pdf 
As shown within this image, India is affected mainly by Maritime Tropical Air Masses, while Eugene is near the area where maritime polar and continental polar air masses come together. The maritime tropical air masses, compared to the maritime polar air masses help explain the drastic difference in temperatures. Maritime polar air masses provide cool moist air, while maritime tropical provide heavy seasonal precipitation that is consistent with consistent warm temperatures and humidity.

Have a nice day!

Wednesday, April 4, 2012

Blog Post 2

Eugene, OR
Blog Post Number 2

As shown from this image, the Eugene, Oregon is primarily affected by Maritime Polar air masses year round. Continental Polar air masses also affect Eugene year round, but it is not as much the normal situation. In certain situations, such as when the polar front moves to the north, Oregon may be affected by Maritime Tropical fronts, although this extremely rare. By far, the most common air mass to affect Eugene is the Maritime Polar, which is characteristic of Eugene's climate, providing cool, moist air.
Image Source: http://www.atmos.illinois.edu/earths_atmosphere/airmasses_fronts.html


This image helps visualize how the air masses flow over the United States with the states outlined clearly.
Image Source: http://teachers.oregon.k12.wi.us/mahr/assignments/airmases_fronts_storms.pdf

This March, 1999 satellite image shows a maritime polar air mass merging with a continental polar air mass, which draws moisture from the maritime tropical and continental tropical air masses from the east over the continent and the Gulf of Mexico, and the west out of the Pacific Ocean.
Image Source: http://www.climate.washington.edu/stormking/HurricanesVsPNWstorms.html

This image depicts a cold front that recently moved through the Pacific Northwest area, including Eugene, and appears to have originated as a result of the Aleutian Low, coming to Oregon in a very predictable pattern. Many continental fronts transform from maritime to continental over the Eugene area
Image Source: http://www.weather.com/maps/maptype/currentweatherusnational/uscurrentweather_large.html
This diagram depicts perfectly how the Aleutian Low affects the Pacific Northwest of the United States.
Image Source: http://bioregionalexplorations.wordpress.com/page/3/

Click to View Animation
This provides an example of a warm front entering the Oregon coast in the Eugene area, then turning to an Occluded front.
Image Source: http://www.hpc.ncep.noaa.gov/basicwx/day0-7loop.html


If the animation above changed this is the next image of the occluded front.
Image Source: http://www.hpc.ncep.noaa.gov/basicwx/day0-7loop.html

Weather moving west to east through the Eugene area, must first rise over an orographic barrier, then sink into Eugene. This makes inversions, fog, and standing weather more common, because weather must rise over a larger orographic barrier to exit the Eugene area. The orographic barrier for weather entering Eugene, creates strong winds in circumstances as well. This terrain map also helps explain how tornadoes are possible in Eugene and north of Eugene. 
Image: Google Maps (Click for full size)

Thursday, March 8, 2012

Blog Post 1


Eugene, OR
Eugene sits approximately 60 miles west of the central Oregon coast. Eugene probably has a low (maritime) bowen ratio, with a rough guess of around 0.25. Eugene offers a temperate climate with winter temperatures averaging in the 40's and summer temperatures averaging in the upper 70's and lower 80's. Eugene is nestled in the Wilamette Valley, at the convergence of two rivers. The weather station chosen is KEUG, located at the Eugene airport (44.1˚N 123.2˚W) which is just north of downtown. The station history goes back to 1939. According to the National Climatic Data Center, the Eugene Area (Lane County) has experienced periods of heavy snow and blizzards, very strong thunderstorms, tornadoes (the last one in 1999 F0), funnel clouds, flooding, and hail. 

Image: USGS, 2011
This topographic map shows the drastic elevation changes that take place in the Eugene Area. Eugene has an elevation of approximately 500 feet, sitting at the base of a valley.
 
Image Source: http://www.world-climates.com/city-climate-eugene-oregon-usa-north-america/
It is evident through this chart that Eugene is warmest in July-August, which is also when it gets the least amount of precipitation. The coldest months are December-January, which is also the peak of the moist season. This year has been a La Nina year, which would suggest that Eugene has received higher than normal precipitation. 

This graph shows the average high temperatures and low temperatures for Eugene in each given month.
Source: 
http://www.weather.com/weather/wxclimatology/monthly/graph/USOR0118

Image Source:  http://graphical.weather.gov/sectors/pacnorthwestWeek.php#tabs
This visual forecast from the National Weather Service indicates a much needed break in precipitation for the Eugene area. This coincides with a news story in The Oregonian stating Portland will be reaching 60 for the first time in 2012 tomorrow. This may support hypothesis La Nina is weakening.  
Image Source: NOAA
The East-West weather patterns, combined with different pressure gradients allow much of the weather that comes to Colorado to enter land through the Pacific Northwest, including Eugene, contributing largely to Eugene's very wet climate. 

GEEBIT
Using GEEBIT B3 to play with Earth's albedo revealed increasing the albedo by just 0.1, cooled earths temperature by 9.7˚C (from -18.8˚C to -28.5˚C). Decreasing the albedo by 0.1, warmed earths temperature by 8.7˚C (to -10.1˚C). Changing Earth's Greenhouse gasses by 0.1 changed earth's temperature less drastically, on average by 2.8˚C. With normal albedo and greenhouse factor, earth averaged about 15˚C. Changing either in either direction could be detrimental to Eugene. A warmer atmosphere could cause more severe weather, or even encroaching oceans. Warmer Pacific Ocean temperatures could bring tropical storms or hurricanes to Eugene. Cooler weather would certainly cause more ice storms. The latent heat flux between the ocean and land may become more dramatic in either circumstance. 

Total Words Excluding Captions: 242