Blog 3: Climate Controls
Eugene, Oregon
Eugene, Oregon
Eugene, OR - An Urban Heat Island?  |
| The population of Eugene. Compiled using data from wikipedia, which used data from the U.S. Census, and Moffatt, Riley. |
 |
| The average annual mean temperature of Eugene. Compiled Using data from weather station KEUG. The temperature compared to the population suggest that Eugene is not an Urban Heat Island, although the data begins during the 1940's, which is likely not the best time to begin a study for urban heat islands as it was the end of the industrial revolution. The temperature shows a negative linear trend, while population shows a positive linear trend, suggesting this may be caused because air quality standards started coming into play, with the phase out of atmospheric heat causing ovens and pollutants. |
 |
| Image Credit: USGS Topo Project (store.usgs.gov) (Click for full size) Shown within this topographic map of Eugene, it is evident Eugene sits at the bottom of a valley, a naturally occurring micro-scale climate control. Eugene is also at the confluence of two rivers, which has proven to make Eugene prone to flooding in the past, and essentially allows the valley to breathe. The rivers, and Eugene's geographic position make Eugene prone to high winds coming down the river valley's to the lowest point (similar to Denver's winds coming down the mountain canyons to the front range). |
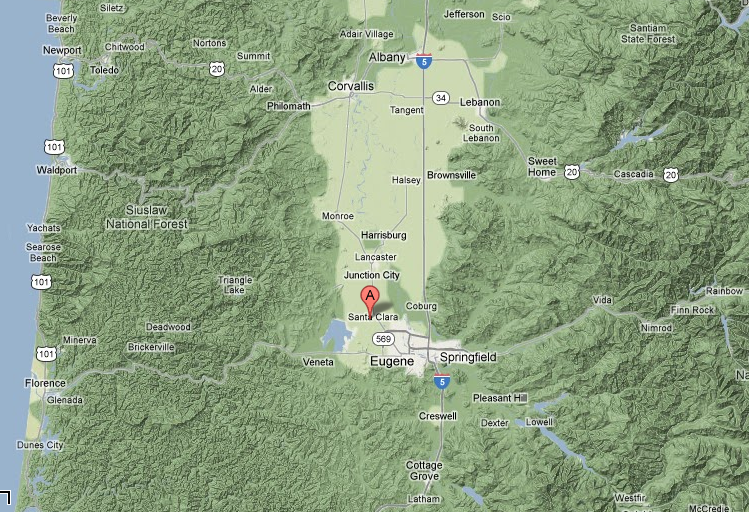 |
| Image Credit: Google Maps Weather Station KEUG is indicated by the red 'A' balloon. Because the weather station is near the south end of the valley, it may experience more wind than in the center of the valley, resulting in cooler temperatures. Fern Ridge Lake, which is to the Southwest of my weather station my affect temperatures at the station depending on the wind direction. The lake may also, on an extremely local level, affect fog, especially during the winter months, and nighttime temperatures due to a higher albedo, and being cooler than the surrounding air, especially during the summer months. The fact that the weather station is at an airport will affect local albedo's, smog, and may contribute to frontal development. Heat from the airport surface, airplanes, and large asphalt parking lots rising and mixing with colder air from the Pacific Ocean, or Aleutian Low, may cause a wave, then cyclonic circulation. The weather station is not typically affected by Interstate 5, or the Eugene-Springfield downtown area, because weather patterns typically move through the area East-Southeast. The weather station, however, may occasionally be affected by the Interstate and Downtown areas if Orographic lifting is required to move an air mass out of the valley, and the air mass presents a cyclonic pattern while stationary in the valley. North of Eugene is heavy agriculture use, which may present some pollution to Eugene, such as pesticides or other agricultural remnants. |
 |
| Image Credit: http://www.nc-climate.ncsu.edu/edu/k12/.JetStreams As shown in this image, the meso-scale air mass dominance can change dramatically in Eugene from summer to winter. During the winter, the jet stream is lower, causing Eugene to be much cooler because of maritime polar and continental polar air coming south, especially off of the Aleutian low. During the summer, the jet stream rises, making Eugene more susceptible maritime tropical air masses, and occasionally continental tropical through mid-latitude cyclonic action. |
 |
| Image Credit:
http://cses.washington.edu/cig/pnwc/pnwc.shtml Eugene is nestled directly between the Coast Mountain Range and the Cascade Mountain Range, suggesting Eugene's orographic situation is a key player in meso-scale climate controls. |
 |
| Image Credit: Wikipedia (Modified Image) According to the Koppen-Geiger Climate Classification System, Eugene sits in a 'Csb' zone, or Dry Summer Subtropical areas. This is contrary to what is commonly believed to be the trend in the Pacific Northwest. Eugene is much drier and warmer during the summer than any other season, so the classification makes sense, although Eugene is not well-known as a 'dry' area. It seems a more accurate climate classification for Eugene, and much of the west coast, would be a weather transition zone, for weather moving from maritime fronts to continental patterns. |
 |
| Image Credit: http://www.world-climates.com/city-climate-eugene-oregon-usa-north-america/ The climograph presented here, supports the Koppen-Geiger Climate Classification for Eugene. |
 |
| The temperature trends graph shows no true consistent trend for Eugene. The trend line for the July minimum temperatures is virtually flat, while the January minimum temperatures trend line is rising, although there is considerable variation among those temperatures. I expected to see an increase in temperatures as the University of Oregon became more established, although I cannot find that trend to exist. The temperature dip of 1955, evident in all except July Minimum temperatures, is also very puzzling. Overall, the temperature trends seem to be warmer winters, but stable summers, which may suggest a shift in frontal patterns, or Pacific Coast currents. |
Have A Nice Day!
No comments:
Post a Comment